In the first part of this series, which discusses Market Share, the information can be found at this link.
I've been a bit slow doing the rest of the analysis of our 2016 CAD Survey, but here is the next chapter. In this installment, we are focused on customer satisfaction.
The survey asked users to rate the packages they use in production with 3 choices:
- It Rocks!
- It's OK
- Not Very Satisfied
In addition, we asked whether the respondents were evaluating new CAD software at this time. We had several hundred respondents, so the numbers should be quite useful.
First, out of the entire audience, 22.7% of them are evaluating new CAD software. 54.7% of respondents thought their current CAD software rocked, 42.99% thought it was OK, and the remaining 2.74% were Not Very Satisfied.
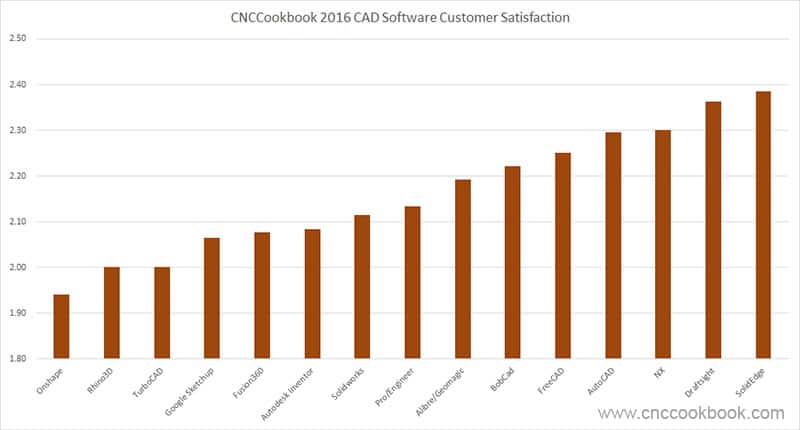
We used these numbers to create an overall customer satisfaction score. A "Not Very Satisfied" or "Evaluating Other Software" got negative scores, an OK counted slightly positive, and an "It Rocks!" was twice as good as an "OK". Note that responding both "Not Very Satisfied" and "Evaluating Other Software" was just as negative as "It Rocks" was positive. In general, the scores are skewed so it was impossible to get a negative score (we wanted it to be easy to see how the scores compare).
We crunched all of those numbers to arrive at an overall customer satisfaction score for the top 15 packages in our survey. We did not score the rest because we felt we didn't have enough responses to be statistically significant. Here are the overall scores:

Overall CAD Package Customer Satisfaction Scores...
I found it interesting how relatively little correlation there is between market share and customer satisfaction. Clearly there are a lot of reasons people buy these packages and their own satisfaction with the package is not necessarily the most decisive issue. It was also interesting that the venerable 2D package AutoCAD did better than full 3D packages like Solidworks and Autodesk Inventor-it has really withstood the test of time. A couple of my own personal favorites, Onshape and Rhino3D didn't fair especially well at all.
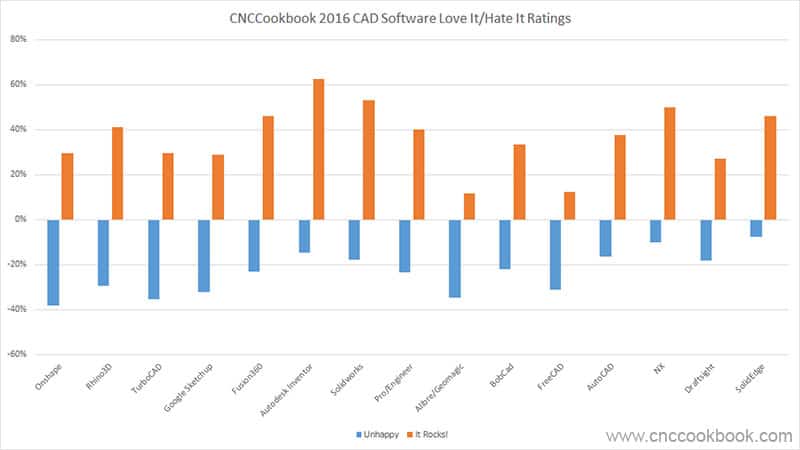
Let's drill down on these numbers to see what more we can glean. Here is a chart showing the percentage for each package that are at the extremes-either "It Rocks" or "Not Very Satisfied." I call it the love it/hate it ratings:

% of respondents who either voted that the package rocked or that they were not very satisfied...
I've kept this chart in the same order as the one above so we can try to make sense of how the two relate. As we can see, most, but not all the packages have a solid following of folks who think the package rocked. Alibre/Geomagic and FreeCAD do not have much in the strongly positive category. We can also see that most packages have some negative ratings, but by and large the strongly positives outweigh the negatives. That leaves the "OK's" to carry the rest of the weight to establish the final score.
I don't want to read too much into these scores as they're somewhat abstract, but they do reflect how people were feeling about their packages when they took the survey. For packages with a relatively high percentage of negatives, I'd be concerned about losing that audience if they can't be made happier at some point.
In Part 3 of the series, we'll drill down to see what the specific strengths and weaknesses were that users reported for each package. If you haven't already, be sure to sign up for our weekly blog newsletter so you won't miss Part 3. The signup is right below.
Be the first to know about updates at CNC Cookbook
Join our newsletter to get updates on what's next at CNC Cookbook.