Note: I've combined all of our 2017 CAM package survey results into this one article so it's easier to track all the data down. In addition, I added the Customer Satisfaction Awards and a new section that tells how to go about building your short list of packages to evaluate.
Wow, over 700 responses in less than a week!
Apparently our CAM Survey is something a huge number of you are interested in. I don't blame you, I'm always fascinated myself to see what the numbers are and how they've changed since the last survey a year ago.
Product Managers at a variety of CADCAM companies, large and small, tell me they find the results very valuable in their own planning. There’s really no other source of information quite like these surveys, so I wanted to get these initial results out as soon as I could.
We’ve done these CAM surveys in 2010, 2012, 2014, 2015, 2016, and now 2017, so there is historical data to compare against when looking for trends.
As in the past, we divide the market into 3 segments:
- High-End: More expensive packages with more functionality.
- Tiered: Modular packages available in a range of configurations that span from the Low-End to the High-End.
- Low-End: Thees are inexpensive packages most commonly used by Hobbyists, but as we’ll see, they’re starting to come up-market to the Professional World.
Let’s start by taking a look by category at market share.
CAM Software Market Share
High-End CAM
This year, High-End CAM was 45% of our responses versus 54% last year. I believe this signals encroachment from some lower-end and tiered packages, especially Fusion360.
We had 28 packages reported on in this segment versus 29 last year-pretty much the same. Like last year, the market remains fragmented. The Top 5 players have 54% of the High-End CAM Software market.
Here are the overall shares in 2017 for the High-End CAM Market:
You haven't provided any text to rephrase. Please provide the text you'd like rewritten.
High-End CAM Software Production Market Share...
Highlights of the 2017 vs 2016 results:
- Mastercam remains #1 at 22% share. In fact, after falling from 27% to 20% in 2016, they've clawed back a couple points of share.
- HSMWorks also came back a bit from 14% to 15.2% and holds the #2 place.
- Esprit has jumped from #8 to #3 and is one of the biggest growth stories for 2017.
- Gibbscam is up from #6 to #4.
- FeatureCAM and SolidCAM are not really changed.
- CAMworks is up from #9 to #7. Of interest were 3 users reporting the brand new integrated Solidworks CAM, which is a derivative.
All in all, nothing really big brewing on the High-End side. Vendors are largely continuing solid performance.
To understand the market share gains and losses better, you’ll want to drill down on some of the other survey analysis such as Share of Mind, Top Features, Top Frustrations, Conversions Rates and Product Strengths and Weaknesses.
We’ll be offering those additional reports as premium free content to our newsletter subscribers only. If you haven’t already, be sure you’re signed up for our weekly blog newsletter. There’s a signup down below this article not too far.
Tier-Priced CAM
The Tier-Priced category consists of products that are sold in modular fashion so you can build a CAM package at virtually any price point depending on how much functionality you need. As such they straddle multiple markets from low-end to high-end.
Tier-Priced CAM was 27% of our responses up from 22% last year. These packages are quite capable, especially Vectric's products, and are starting to eat into some of the High-End CAM market share.
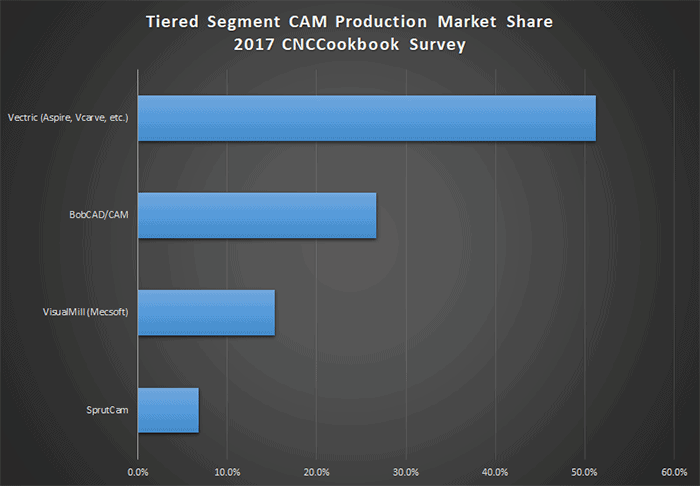
Tiered Segment CAM Market Share...
Here's what we see in this segment compared to 2016:
- After huge growth last year, Vectric continues to grow even more, moving from 41% to 51% share.
- BobCAD has lost some ground last year, falling to 17% share. This year, they've kicked back up to 27%.
- Mecsoft is at 15% vs 10% last year.
- SprutCam is at 7% vs 31% last year. Most of the share gains within the segment seem to have come at Sprut's expense.
Last year we saw signs that the free Fusion360 was really damaging this segment, but the trend seems to have reversed. It's always interesting to see how well established products can compete with free upstarts. We'll have to keep watching to see if it holds, but it seems like free may not have been as big a threat as expected.
BTW, we just got the full Vectric CAM suite in at CNCCookbook and I plan to start digging into it more in-depth soon!
Low-Cost CAM
These are the packages that Hobbyists and “Prosumers” (low-end business + high-end hobbyist) thrive on because their price points are relatively low. One has to wonder though how many Pros are using Fusion360, which is quite a capable product.
Like last year, Low-Cost was our 2nd largest category. At 28% share, it's down a bit from the 32% share it had last year.
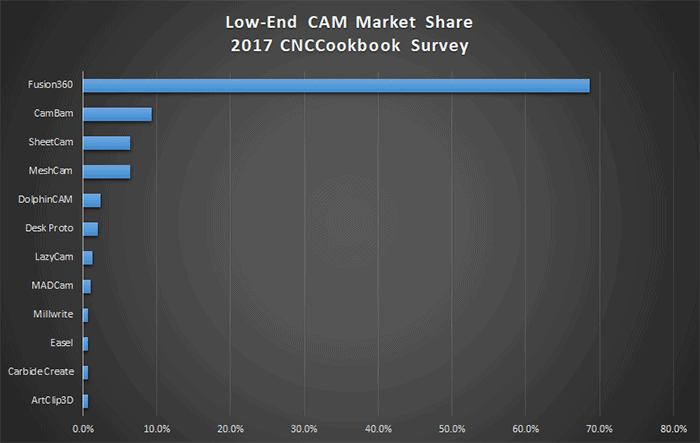
2017 Low-End CAM Market Share...
- It's no surprise as Fusion360 continues to dominate this segment. But, its phenomenal growth may have plateaud. It's at not quite 69% growth versus 67% last year. It will be interesting to see at what point Autodesk decides that since it has quit taking further market share, it's time to start extracting more revenue from the product by raising prices.
- Cambam is still at #2 with 9%. It lost about 1% versus last year.
- MeshCam is down further from 9% to 6% while SheetCam has popped up a bit to tie at 6%.
Most of the others are down a bit as the low-end market continues to consolidate.
CAM Software Customer Satisfaction Awards
One of the most interesting parts of our CNCCookbook 2017 CAM Survey Results is the Customer Satisfaction. We ask respondents to rate their CAM packages on a scale of:
- It Rocks
- It’s OK
- Not Happy
Having only 3 values keeps it simple. In addition, we ask whether they’re actively seeking a new package, which would be a sign that Customer Satisfaction was not 100%. We convert those responses to a numerical score.
A perfect score would mean everyone voted “It Rocks” and none of the voters were considering a new package. That would be a score of “2”. If everyone was unhappy and looking for a new package, it’d result in a score of “0”. A “1” would therefore be fine for a package that gets the job done, but that nobody really loves or hates.
We divide the products into Gold, Silver, and Bronze Award categories. There is only one Gold, one Silver, and one Bronze awarded for each of our Market Segments, unless there is a tie on scores.
While it is tempting to assign importance to Gold being better than Silver and Silver better than Bronze, the reality is that capturing any of these awards is no mean feat.
Every user is different, and many will find they prefer the Silver or Bronze choices to the Gold based on what they need to get from their CAM software and how intuitive they find each package to be. If you’re evaluating CAM software, you owe it to your self to look at all of the winners to find the one package that makes the most sense for you.
Without further ado, here are the CNCCookbook 2016 CAM Software Customer Satisfaction Award Winners:
High-End CAM
Surfcam took the Gold Customer Satisfaction Award for 2017. Their score of 1.41 was excellent. Despite 47% of Surfcam respondents being on the lookout for a new package, Surfcam won by virtue of having 65% of respondents say that, "It Rocks!" Congratulations to Surfcam!
Congratulations to SolidCAM for taking the Silver Customer Satisfaction Award for 2017. They scored 1.19, with a very low 17% evaluating alternatives rate and a very decent 48% "It Rocks!" response.
The Bronze Customer Satisfaction Award for 2017 goes to FeatureCAM. They had the lowest evaluating alternatives percentage of any package-9%. Their customers aren't going anywhere from the looks of that. Their "It Rocks!" score was 32%. Customers like what FeatureCAM is trying to do, they don't think there are alternatives worth considering, but there's room for FeatureCAM to delight their customers further.
Tiered CAM
Vectric say they're passionate about CNC, and clearly their customers are passionate about Vectric's CAM Software. Congratulations to them on receiving our Gold Customer Satisfaction Award for 2017. Vectric customers are the least likely (only 17%) to evaluate other CAM Software in the Tiered category. They also awarded Vectric with the highest percentage of "It Rocks!" evaluations-46%.
Congratulations to MecSoft for receiving the Silver Customer Satisfaction Award for 2017. Only 23% of Visual Mill users are evaluating alternatives, and 40% say "It Rocks!". Solid numbers for MecSoft.
The Bronze Customer Satisfaction Award for 2017 goes to Sprutcam. 15% of users are evaluating alternatives-a very low number. 30% rate SprutCam as "It Rocks!".
Low-Cost CAM
Congrats to Fusion360 for taking the Gold for the second year running. Only 16% of users are considering alternatives while a whopping 56% say, "It Rocks!"
CAMBAM took Silver for the second year running as well. Congrats!
The Bronze goes to MeshCAM. MeshCAM tied with CAMBAM last year, but this year was just a little behind. Only 11% of users are considering alternatives-the lowest score in the category. But, it only got 5% "It Rocks!" responses. It did get absolutely the lowest "Not Satisfied" score of any package in any category, so I'd interpret customer satisfaction as telling us that MeshCAM does the job well, they're not looking to replace it, but there's room to delight customers further.
How to Create a CAM Package Short List
Given the info we've presented, how do you go about creating your short list of which packages to evaluate?
Evaluating New CAM Packages at this Time
One of the first questions to answer is how many packages should you evaluate? Our survey suggests the average respondents looks at 3 possibilities.
It also suggests that about 17% of respondents are considering switching or at least acquiring a new CAM package at this time. In the 2016 survey, 26% were evaluating new CAM, so there are a lot fewer organizations looking.
How to Build Your CAM Package Short List
We’ve delivered a lot of the ingredients you’ll need to put together your short list:
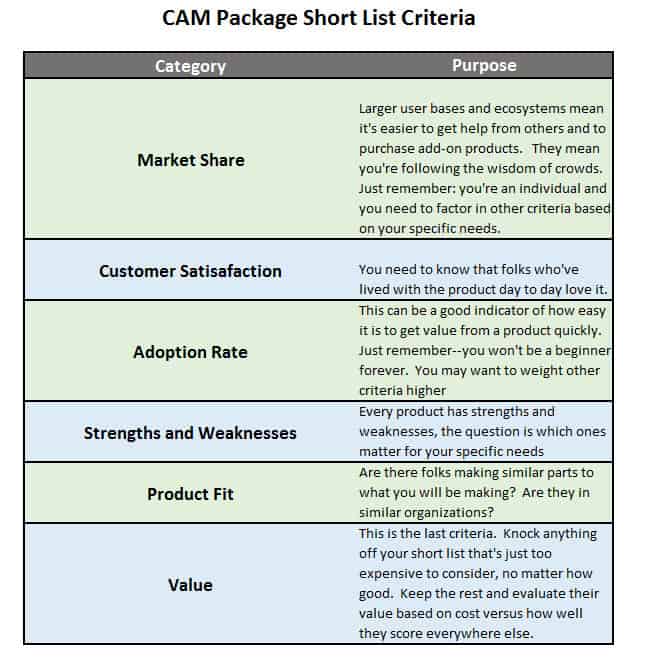
Let’s go over each category of information and talk about why it matters and how you can research it.
Market Share
We always want to understand how popular things are before we adopt them–it’s human nature. We’re hardwired to care about it for very good reasons–popularity is a good proxy for some very important things. It harnesses the wisdom of crowds in your favor. Popularity gives you insight into the hard work others before you did evaluating products.
But, be careful!
You’re an individual with specific needs. Popularity is far from everything. There are popular packages that you might find terrible for your needs, and less well-known packages that might be just perfect for you.
All I’m saying is popularity can only be one of the dimensions you consider.
Popularity is also important because it goes to the size of the community and ecosystem that are behind a product. Popular products are easier to find help for. There are more people you can ask. More people with experience who can help or even be hired by you. There will be more add-on products, training, and other resources to choose from.
Determining popularity used to be hard. People paid a fortune to market researchers to buy their proprietary reports. CNCCookbook changed all that by giving away such results in the form of our surveys. We cover a huge part of the market–four and a half million visits a year to our web site and hundreds of participants in the surveys.
Customer Satisfaction
This one is important–it tells you what the people who’ve lived with the product day to day really think. These are the folks that eventually did master the product, not just the looky loos and the people who have an opinion about everything.
Here again, this used to be hard to find anything about. But, CNCCookbook is now giving annual customer satisfaction awards to CAM Software vendors and you get to see who they are. Take full advantage of that information as you’re building your short lists. Give extra weight to those products whose customers are particularly enthusiastic about them and be a little more skeptical of others.
Don’t just take our survey’s word for it either. Once you have narrowed your list a bit, go visit the online community for the software. If they won’t let you in before you buy, go to online communities you have access to that talk about the product. Check into the following:
- Common complaints
- Seriously unhappy customers and what their story is. It’s okay if there are a few, but do the other participants try to support the product and suggest their experiences were better, or do they just kind of stand back? The best products will have fans that come to the rescue when others are running it down.
- Passion: Are their folks extolling the virtues of using the software?
You get the idea of what to look for. This kind of research is easy to do in our digital world and very valuable.
Make sure a few of the winners land on your short list.
Adoption Rate
We just covered adoption rates. My primary thought is to use them as a way to understand how easy it is to realize the value of a product during the evaluation. That doesn’t mean products with lower adoption rates can’t be valuable–it just means you’ll have to work harder or learn more than people do during an evaluation to get there.
It’s like the difference between ease of learning and ease of use. These are not the same thing if you think about it. Ease of Learning is how easy it is for a beginner to get started using the product while ease of use is how easy for someone who knows the product to be productive with it.
Strengths and Weaknesses
CAM Software, like a lot of other things, is not really one-size-fits all. Your needs may not be the same as the next CNC’ers needs. We can approach this in a couple of ways. The first thing to check out are the product’s strengths and weaknesses.
Try to compare the Strengths and Weaknesses to your needs. If you don’t plan to run 5-axis any time soon, it’s probably not an issue if this is not a strength. On the other hand, if you are going to be making complex parts and you need to save every last penny, you probably want a package that’s strong on toolpaths.
Product Fit
Is a gauge of similarity to what others are doing. Do the same kind of online community research I described under Customer Satisfaction. This time you’re looking for:
- Photos, stories, and examples of parts and projects made with the product that are similar to what you want to do.
- Get a feel for the audience–are they people like you? Radically different? Can you relate to what they have to say?
These are all clues about how good a fit this product might be for you.
Value
This should be the last thing you research, and not necessarily the first. I am very deliberate in choosing the word “Value” over “Price.” A cheap product may be worthless if it doesn’t solve your problem, or if it makes it so hard that you more than offset any savings with frustration and extra time spent.
You have some idea of your budget, so knock out the products that are clearly way out of bounds first. After that, you’ll be focusing on value rather than price. Value is defined roughly as Utility divided by Price. You might be willing to pay twice as much for something that is twice as useful, or at least you’re more likely to consider the higher price. For two products of roughly the same utility, why pay more?
You can see why Value has to be considered last–all of the other dimensions are put together using a weighting scheme to arrive at the Utility for the package to you.
Let’s use a sample Excel worksheet to quantify how that might work.
A worksheet for building your CAM Software Short List
Go ahead and click this link to download an Excel worksheet you can use as a template to create your CAM Software Short List. It looks like this:
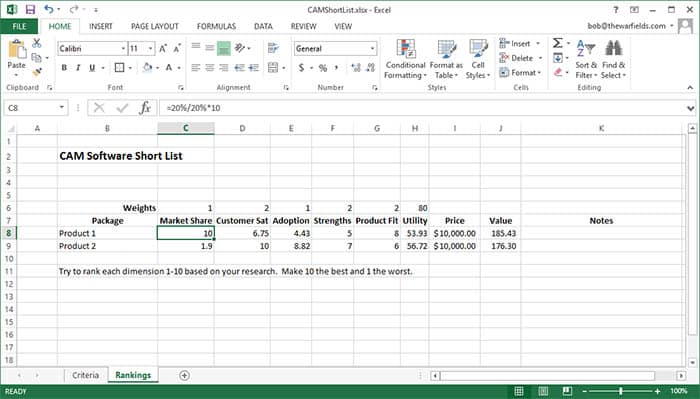
You can see there are columns representing each dimension–Market Share, Customer Sat, etc.. The goal is to rate each package on a scale of 1 to 10 for each dimension. Make sure 10 is the best and 1 is the worst so we have apples to apples.
Notice how there are numbers above the dimensions and they’re labelled, “Weights.” This allows you to weight each dimension as you like. Ignore the numbers there, they’re just hypotheticals. Enter whatever you like for the weights, but leave the value above Utility alone. It represents the highest utility score any package can get if every dimension scored a perfect “10”.
That’s right–Utility aggregates the weighted scores to create an overall utility score for each package. We then take the price, divide by the Utility, and arrive at Value. It’s sort of a $ per utility rate, so smaller Values are better.
When you have everything filled out, sort in descending order of value. Take the top 2 or 3 packages and evaluate them fully to see who the real winners are.
As far as individual formulas for the dimension ratings, you either eyeball it as I did with Product Fit, or try to create more quantitative metrics.
For example, on Market Share, I took the largest market share (20%), and scaled 1 to 10 based on how large a share this package had. This is based on the Market Share values from our survey. On Customer Sat, I took a theoretical perfect 2.0 score, figured what percent the sat was from CNCCookbook’s surveys, and scaled that to a 1..10 value.
There’s no point in getting to crazy and analytical about what are in the end of the day somewhat subjective numbers, but it can help to be a little rigorous in converting them to your 1 to 10 ratings.
If you create a worksheet like this, it can really help you narrow your choices in an educated way to a small number of packages which you’ll then do a full evaluation on.
What are you thoughts on how to create the best short list of packages to evaluate? Tell us in the comments!
More CAM Software Market Intelligence
There’s a lot more information to be gleaned from the responses. In this installment, I’m going to go over:
- The types of CNC Machines in use by the Survey Participants.
- The relative mindshare of the various packages in terms of how widely they’ve been tried by our participants.
- The adoption rate or likelihood of purchase on trying each particular package.
- The number of folks evaluating new CAM at this time.
- The number of folks who’ve used Conversational Programming, another approach to getting g-code that doesn’t require CADCAM for simple jobs.
Let’s dive in!
Type of CNC Machines in use by Survey Participants
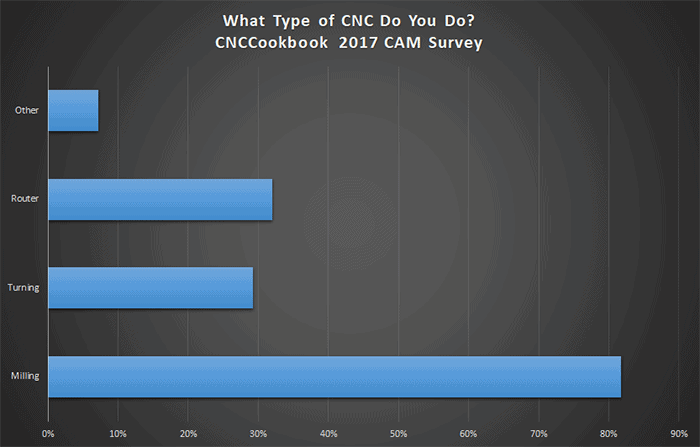
This gives an idea of our audience make up. I get asked a lot about CNC Router / Woodworkers and as we can see, about a third of our audience has experience there. The “Other” category consists of things like plasma tables, waterjets, 3D printers, and the like. The numbers add up to more than 100% because many are using more than one kind of machine.
Mindshare of CAM Packages
When asking which CAM packages respondents had used, the question was broken down into two variations:
- Used the CAM software in production
- Evaluated or tried the CAM software
Of course many more try software than wind up using it in production. By looking at the relative popularity on the “tried” category, we can get an idea of the mindshare of each package. Put another way, it’s a measure of how widely the software has been tried by the community.
As with the market share numbers, we consider mindshare broken down into the same segments defined in the first results article.
High End Segment
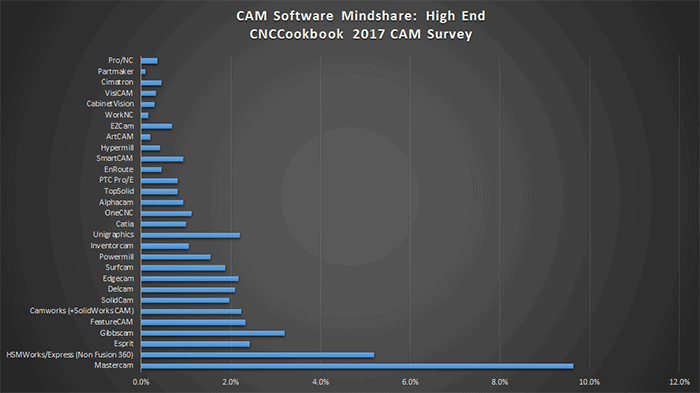
The best known package is Mastercam, followed by the HSMWorks versions, GibbsCAM, and Unigraphics NX. Compared to the 2016 results, FeatureCAM and Camworks have lost a little visibility relative to these other packages. Unigraphics NX seems to have moved up the most.
Tiered Segment
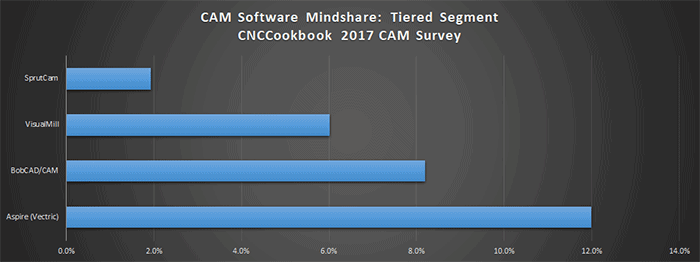
Aspire, followed by BobCAD and then the various Mecsoft products have the highest mindshare in the Tiered Segment. Vectric’s products stepped over both BobCAD and VisualMill in the last year to take the lead.
Low End Segment
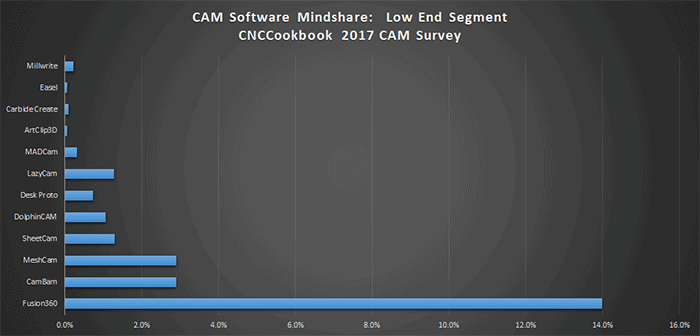
In the low-end, it should be no surprise that Fusion360 is the runaway leader–it’s tough competing with free. Tied for second place are CamBam and MeshCam. This is basically unchanged from 2016, interestingly enough.
Adoption Rates
If you try one of these CAM packages, how likely are you to purchase it? Presumably higher adoption rates show that users easily decide they like a package after trying it. That’s a good thing, right?
Overall, respondents evaluated 3 CAM packages for every 1 they bought. That’s a healthy look around. It is quite a lot of work to evaluate a CAM package very fully.
High End Segment
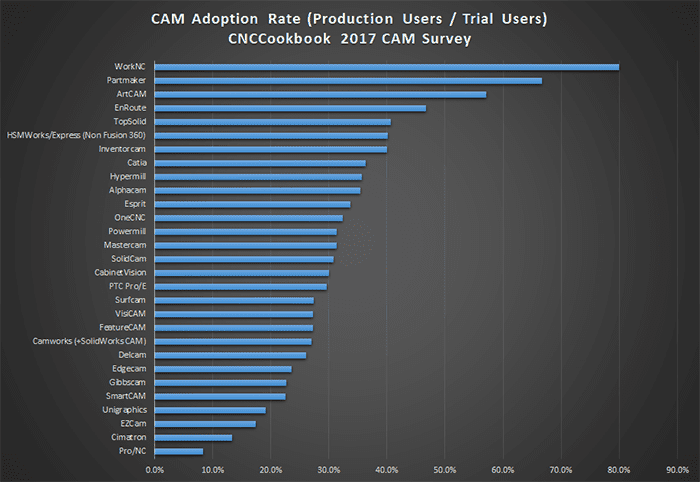
There’s been quite a lot of change here. Unclear what that means, but in 2016 PowerMill was the King followed by HSMWorks, AlphaCam, and Solidcam. Now we have WorkNC, Partmaker, ArtCAM, and Enroute. HSMWorks still ranks decently high in the pack.
Looks like a lot more folks tried these packages, but without ultimately buying them.
Tiered Segment
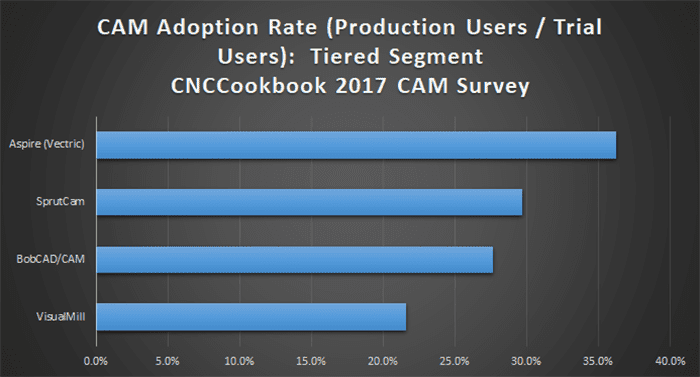
In the Tiered Segment, the Aspire family has the highest adoption rate followed by SprutCam, BobCAD, and VisualMill / Mecsoft’s family. In 2016, SprutCam was much closer to Aspire and VisualMill was ahead of BobCAD.
Low End Segment
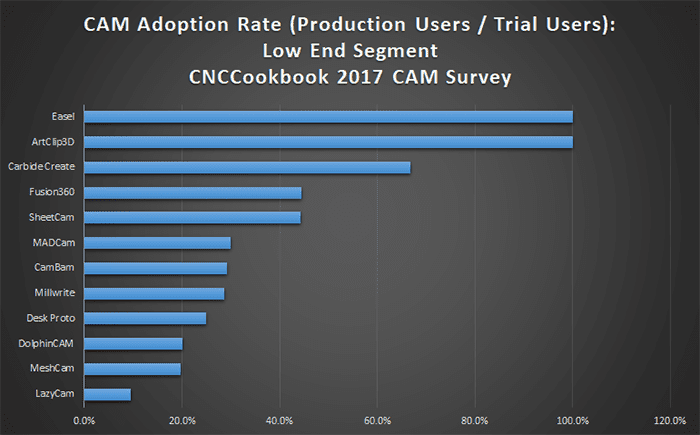
The low end is dominated by easy-to-use carving software including Easel, ArtClip3D, and CarbideCreate. Fusion360 comes in right below, but I can see that for beginners, these others are much easier to start with.
In 2016, it was Fusion360 with CamBam and MeshCam tied for second place.
Conversational Programming
Conversational Programming is a time saving and simpler alternative to CADCAM for certain jobs. I like to think of it as making it super easy to do all the sorts of things manual machinists do just by filling out a quick wizard.
Conversational Programming can be delivered as a stand-alone software package like our G-Wizard Editor or it can be built right into your CNC Control. It can make it a breeze to make simple parts or to add simple features to other parts.
This year, 45% of respondents reported they had used Conversational Programming. I’m surprised there aren’t more given how convenient it is.
Want to Learn More About These CAM Packages?
If you're with a firm that needs even more in-depth information on CAM Packages, get in touch. We offer a premium service where we drill down on our survey responses to try to glean information about specific queries you may have.
Be the first to know about updates at CNC Cookbook
Join our newsletter to get updates on what's next at CNC Cookbook.